Introduction
This note examines how the Canary Islands (CI) has fared, particularly compared to the rest of Spain, during the 21st century. First we will examine GDP/capita, which provides an overall view of the economic health of the region wealth per person and is a widely accepted measure of whether of how wealthy, on average, a population is.
We next look at average incomes and the cost of living and finally the public debt of each region (Comunidad) of Spain. The public debt is shown per person and also as a percentage of GDP, which is an indicator of the ability to shoulder the debt person.
The note finishes with view on whether the development of a major transit hub in the Canary Islands, as promoted by Coalición Canaria in their election manifesto, is likely to succeed in developing wealth for the islands.
GDP/Capita
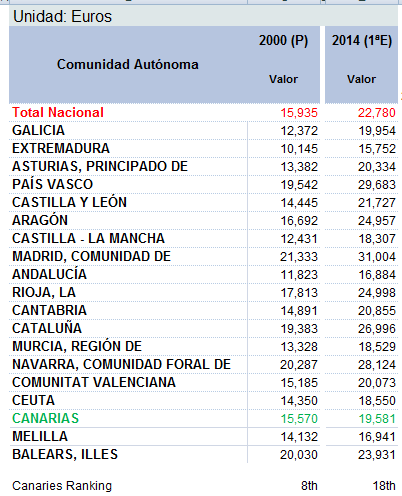
CI has certainly slipped down the rankings significantly, from 8th to 18th place. In 2000, CI was just a few hundred Euros below the average for Spain but now is over €3,000 adrift from the average. If this trend were to continue – and it is a very big if – CI would be the poorest community in Spain by around 2030.
Average incomes and prices
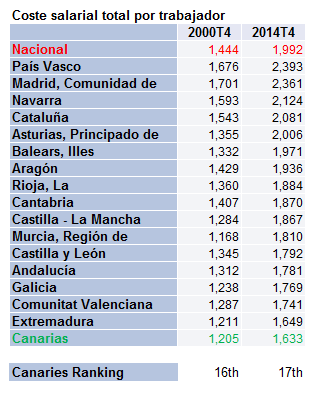
CI has consistently had lower average salaries than the rest of Spain. In 2000, the Comunidad of Murcia had lower salaries than CI but by 2014, CI was the cheapest of all regions, with Extremadura only slightly higher. Monthly salary in CI is now around 80% of the national average.
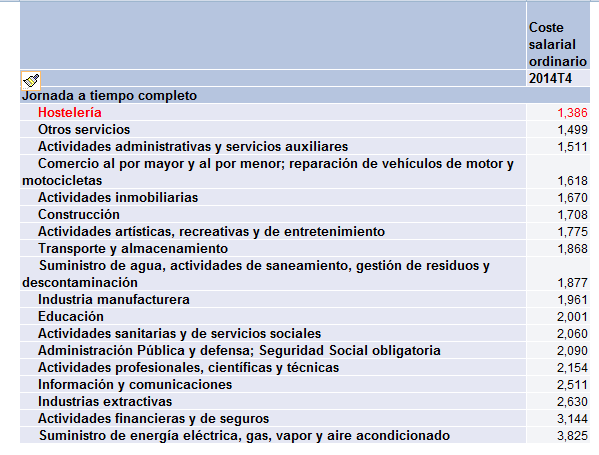
One of the causes of low salaries is the islands’ dependence on tourism. Of the 18 sectors of the economy for which INE measures salaries, hospitality was easily the lowest of the 18 in 2014.
An offsetting factor is how much consumer prices have increased over a similar period. CI does stand out from the rest of Spain as having significantly lower inflation, of 22%, compared to a nation-wide average of 29%.
Regional Debt
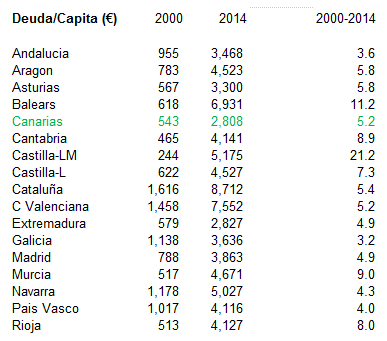
CI has traditionally carried low levels of debt and, by 2014, the debt per person was the lowest in Spain; at €2,800 per capita, the figure is less than a third of that shown for Cataluña.
The last column shows how the debt has increased over time. In 2014, Canarian debt per person was a little over five times as high as in 2000, which is identical to the national average.
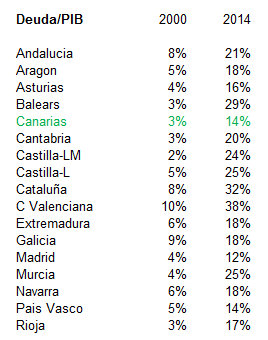
The amount of debt is of less concern if a region generates sufficient wealth to service this debt, however. So, our final bit of evidence shows, for each region, its debt as a proportion of GDP.
From this last table, we can see that the regional debt of the CI is relatively manageable, especially when compared to the eastern regions of Spain (Balearics, Cataluña, Balearic Islands). Please note, however, that these figure take now account of the regional share of national debt, which is much higher in 2014 than was the case in 2000.
Conclusion
Although the CI is not overly burdened with debt and inflation has been relatively benign, the fact remains that CI has become poorer relative to Spain’s other regions, based on the evidence provided in this note and this should raise question marks about the how the Canary Islands have been managed.
The ruling party throughout this period, Coalición Canaria, has included in its 2015 manifesto aspirations to develop the Archipelago as a regional trade hub, given its position off the coast of Africa and part way across the Atlantic. But this aspiration itself, even if achievable, poses an inconvenient political question. There could only be one hub port which could be promoted to fulfil this aspiration, which means that either Tenerife or Gran Canaria will lose out and the benefits of such a strategy are unlikely to trickle down to the remaining islands.
